Do Implicit Bias Tests Work? What They Measure, What They Miss, and a Different Question Worth Asking
Millions of people have taken an implicit bias test. Here is what the research actually shows about the number it gives you — and what it would take to measure something more useful.
If you have taken an implicit bias test, you probably remember the result better than the instructions. A label arrives at the end — slight, moderate, strong — and it lands like a verdict. It is worth knowing what that label is built on, because the answer is more interesting, and more useful, than either “it proves you are biased” or “it is junk science”.
The question underneath the question
Before asking whether a test is accurate, there is a duller question that has to come first: is it stable? If you take the same test twice two weeks apart and get two different answers, then at least one of them is wrong, and the test cannot tell you which. Psychologists call this test–retest reliability, and it is the ceiling on everything else. A measure that does not agree with itself cannot agree with reality.
This matters more than it sounds. Reliability is not a technicality that only researchers care about — it is the difference between a bathroom scale and a magic 8-ball. Both give you a number.
How the implicit association test scores on its own terms
The Implicit Association Test (IAT) asks you to sort words and images into paired categories as fast as you can. When two categories share a key and the pairing feels natural, you are quicker. The gap between your speed on one pairing and the other becomes a score. It is an ingenious design, it has been studied for nearly thirty years, and it has generated genuinely important research.
Myth Your IAT result tells you how biased you are.
What the research says Its publisher disagrees. Project Implicit’s own ethics page states that the test “cannot and should not be used for diagnostic or selection purposes” and “does not meet the standards of measurement reliability for diagnostic use”.1 That is not a critic talking — that is the people who run it.
Myth A stable result means a stable trait.
What the research says Test–retest reliability for IAT measures averages about 0.50 across 58 studies2; a later analysis of more than 100,000 people put it at 0.35, pooled across ten intergroup domains3. At that level, roughly half of a single sitting is specific to that occasion — which is why category labels flip between sessions as a matter of course.
Predictive validity — whether the score forecasts what someone actually does — has drifted downward as samples have grown. A 2013 meta-analysis in JPSP put the correlation with discriminatory behavior at about 0.148, roughly 2% of the variance, and found the IAT performed no better than simple self-report questions4. A 2024 analysis pooling ten intergroup domains and 250 outcomes put it at 0.0793.
And the mechanism itself is now contested. A 2026 registered report in Nature Human Behaviour, covering 39 topics and more than 115,000 participants, found that how cautiously a person trades speed for accuracy explained more of the variance in scores than decision ease — the associative component the score is meant to capture5. That is not a fringe objection; it is the largest and best-controlled study of the instrument’s mechanics yet published.
The step that usually gets skipped
Suppose the measurement problem were solved tomorrow. There is still a link in the chain that rarely gets examined: does knowing your score change what you do?
The largest attempt to answer that is a network meta-analysis of 492 studies and more than 87,000 participants. Implicit measures can be nudged, weakly. Effects on behavior were described as trivial. And decisively: changes in implicit measures did not mediate changes in behavior6. A companion study tested nine interventions; all nine moved the score immediately, and none survived a delay of a few hours to a few days7.
There is one outcome that does hold up, and it is worth being precise about. A meta-analysis of 260 independent samples and more than 29,000 participants separated four kinds of result. Reactions, attitudes and behavior all decayed over 0–24 months. Cognitive learning — knowing what a pattern is, what it is called, how to spot it — stayed stable and sometimes grew8. What sticks is the knowledge, not the sentiment.
A different question: what did you not notice?
A blind spot is not an attitude. It is the gap between what was in front of you and what you registered. That distinction turns out to matter enormously, because a gap has a ground truth and an attitude does not. If a transcript shows that one person proposed something at 09:12 and a second person was assigned it at 09:19, that is a fact you can point at. Whether anybody harboured a feeling about anyone is not.
That is the design behind our Blind Spots exercise. You read short workplace moments — a meeting transcript, a close-out report, two sets of appraisal notes — and say whether you think something is going wrong. What is planted in each one is structural and checkable: who said it first, what the contributions table lists, how many times a standing item was cut for time. Not a claim about anyone’s motives.
And here is the part most tests of this kind get wrong. About half the moments have nothing planted in them at all. They contain ordinary friction with an innocent cause stated right there in the text — a proposal declined because the budget was committed, a curt reply from someone who has been handling an escalation since 4am, feedback that is thin for everyone rather than for one person.
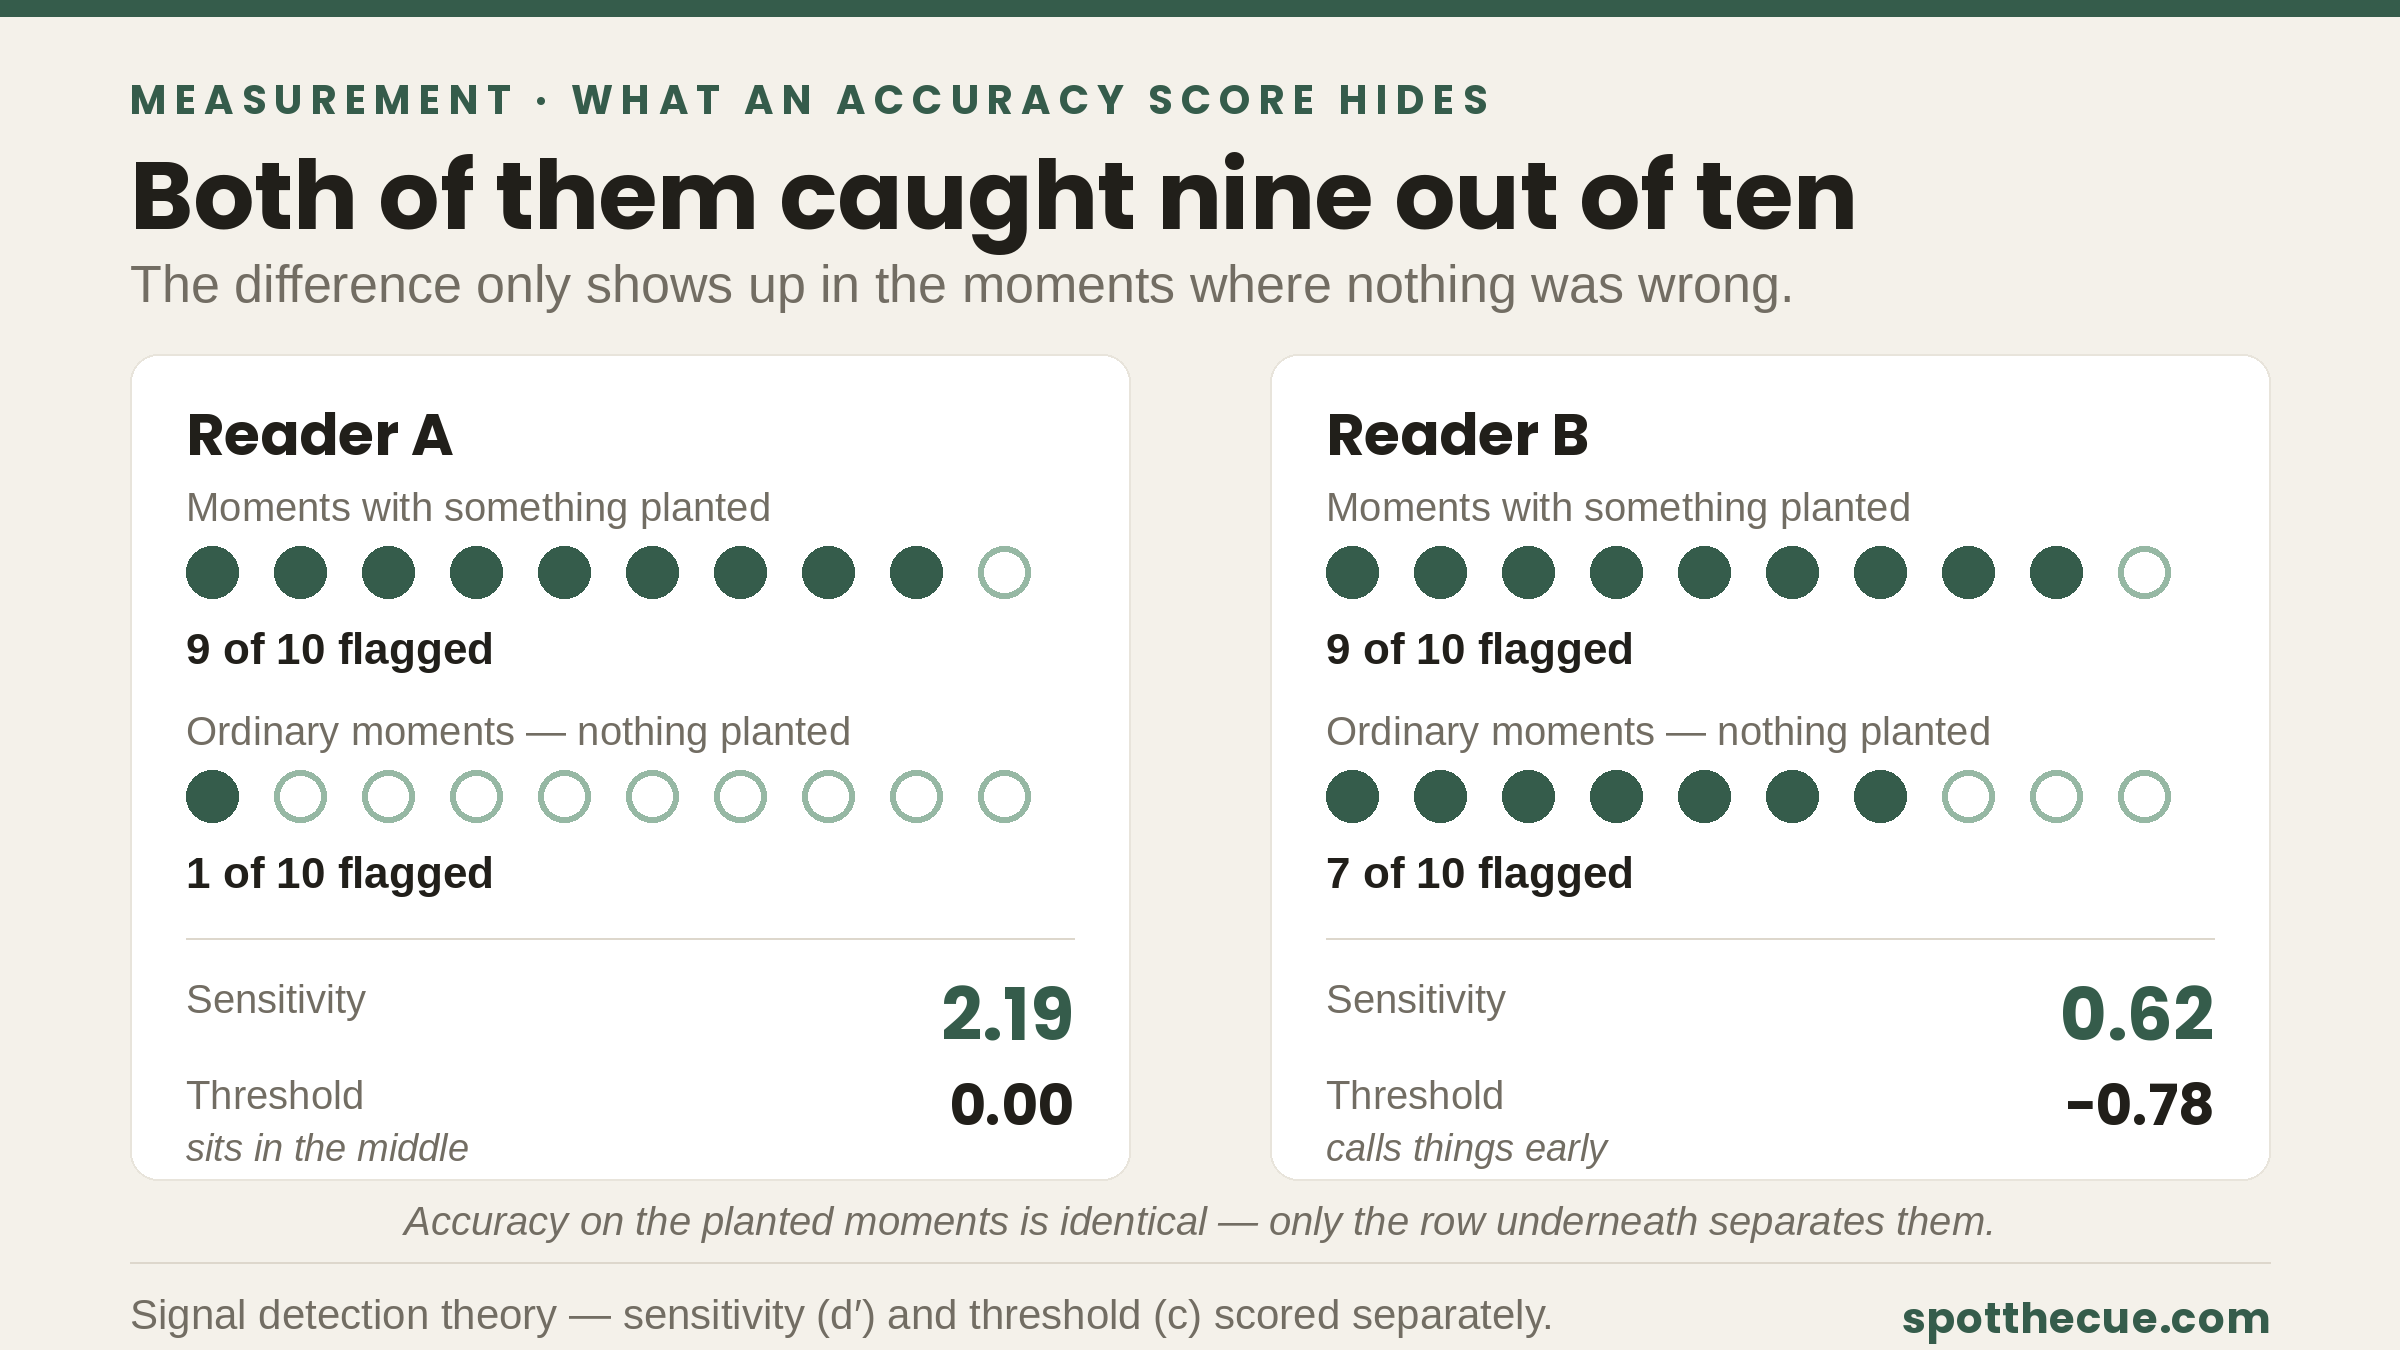
Without those, the exercise would be worthless. Consider two readers who both catch 9 of 10 planted moments. One of them flagged 1 ordinary moment; the other flagged 7. Their accuracy on the problems is identical, and they are not remotely the same reader. Only the ordinary moments reveal it — the approach is borrowed from signal detection theory, which separates how well you tell two things apart from how readily you call something a problem9.
The five patterns it looks for
Credit drift
An idea enters the record from one person and leaves it attached to another. Usually a memory failure rather than anything deliberate — in a classic study, people plagiarized a fellow group member on roughly 4–15% of responses depending on the task, against a baseline repetition rate under 2% — and the likeliest source was whoever had spoken immediately before them10.
The ambiguity tax
When joint work leaves individual contribution unspecified, credit defaults along the lines of expectation. Notably, three separate manipulations made the effect disappear — giving individual performance feedback, clarifying how the task was structured, and showing specific evidence of prior competence11. It is driven by missing information, not by animus.
Pattern escalation
A second incident read as a pattern rather than as a second incident. In a study of teacher responses to two minor infractions, whether the second was construed as a trend mediated how severely it was handled12.
Vague praise
Feedback that is warm but carries no instance, so it cannot be acted on or cited when it counts. “A joy to work with” and “cut average handling time from nine minutes to four” are both compliments. Only one of them survives a promotion panel.
Airtime asymmetry
Turns, interruptions or standing agenda time distributed unevenly between people at the same level. Worth counting once rather than trusting an impression — perception of airtime is unreliable and a transcript is not.
What it reports, and what it refuses to
Two numbers. Sensitivity is how reliably you separated the planted moments from the ordinary ones. Threshold is how readily you call something a problem — and neither end of it is the good end. Flagging everything and flagging nothing are both costly, in different ways, so the exercise describes where you set the bar rather than grading it.
That refusal is deliberate, and it is not squeamishness. Priming someone to feel objective has been shown to increase discriminatory decisions in hiring tasks13. A screen that congratulates you on being fair-minded is the single most counterproductive thing a tool like this could produce — which is why there is no badge, no share card, and no “you passed”.
What this is worth to a team
Here is the claim we will not make: that taking an exercise makes anyone less biased. Section three of this post is the reason. What the evidence supports is narrower and, we think, more useful — people retain what they learn about a pattern, and changing the procedure changes the outcome regardless of what anyone believes.
So the exercise is an on-ramp and a shared vocabulary, not a fix. The fixes are procedural, and these are the ones with real evidence behind them:
- Structure your interviews. Structured interviews predict job performance roughly twice as well as unstructured ones — 0.42 against 0.19 in the current best meta-analytic estimates14 — and a field study of nearly 20,000 real applicants found demographic-similarity effects in highly structured interviews were trivially small20.
- Prompt at the moment of decision. In a randomized trial across 3,644 managers and 367,805 applications, a seven-minute video watched immediately before shortlisting made a woman 3 percentage points more likely to reach the short list, and raised the hiring of non-national women by 41% in relative terms. Hiring of women overall did not move significantly — the effect is on who gets seen15.
- Compare candidates side by side rather than one at a time. In a controlled study, evaluating separately produced a 16-point gap favoring the stereotype-advantaged candidate; evaluating jointly eliminated it and substituted actual performance16.
- Attribute contributions in the notes as they are made, and make individual contribution legible before the credit conversation rather than during it11.
- Log incidents. Judge the third against the log rather than the second against a feeling.
- Make it voluntary. Across 829 firms and three decades, mandatory diversity training was associated with falls in managerial representation for some groups, while voluntary training and accountability structures such as task forces showed the largest gains in the dataset17.
It is equally worth knowing what does not hold up. Anonymizing applications is widely recommended and has repeatedly disappointed in the field: an Australian trial of more than 2,100 public servants found de-identification made female and Indigenous candidates less likely to be shortlisted, because reviewers had been applying a deliberate thumb on the scale that blinding removed18. A French randomized trial found anonymous résumés widened the gap for minority candidates in the firms that volunteered for the scheme19. Good intentions and good evidence are different things.
What we do not know yet
The obvious question to ask of any new instrument is the one we asked of the IAT at the top: does it hold steady between sittings? We do not know yet, and we are not going to pretend otherwise. The exercise ships in two parallel forms so that people can take one, come back a week later, take the other, and let us compare the two.
We have written down in advance what each result means. If the correlation comes back above 0.60, the personal reading stands. Between 0.40 and 0.60, we will only show a number to people who have completed both forms. Below 0.40, the personal number gets withdrawn and the exercise becomes a teaching tool with a group-level readout. Committing to that before seeing the data is the only point at which it can be decided honestly.
Now try reading a cue under a little pressure.
Short scenarios, instant feedback — free to start, no sign-up.
Sources
- Project Implicit. Ethical considerations. Harvard University. Link ↗
- Greenwald, A. G., & Lai, C. K. (2020). Implicit social cognition. Annual Review of Psychology, 71, 419–445. Link ↗
- Axt, J. R., Buttrick, N., & Feng, R. Y. (2024). A comparative investigation of the predictive validity of four indirect measures of bias and prejudice. Personality and Social Psychology Bulletin, 50(6), 871–888. Link ↗
- Oswald, F. L., Mitchell, G., Blanton, H., Jaccard, J., & Tetlock, P. E. (2013). Predicting ethnic and racial discrimination: a meta-analysis of IAT criterion studies. Journal of Personality and Social Psychology, 105(2), 171–192. Link ↗
- LaFollette, K., Rubez, G., Demaree, H., & Goldenberg, A. (2026). Challenging the mechanism for the implicit association test. Nature Human Behaviour, 10(6), 1161–1173. Link ↗
- Forscher, P. S., Lai, C. K., Axt, J. R., Ebersole, C. R., Herman, M., Devine, P. G., & Nosek, B. A. (2019). A meta-analysis of procedures to change implicit measures. Journal of Personality and Social Psychology, 117(3), 522–559. Link ↗
- Lai, C. K., Skinner, A. L., Cooley, E., et al. (2016). Reducing implicit racial preferences: II. Intervention effectiveness across time. Journal of Experimental Psychology: General, 145(8), 1001–1016. Link ↗
- Bezrukova, K., Spell, C. S., Perry, J. L., & Jehn, K. A. (2016). A meta-analytical integration of over 40 years of research on diversity training evaluation. Psychological Bulletin, 142(11), 1227–1274. Link ↗
- Merritt, S. M. (2026). A missed opportunity: how signal detection theory can advance research on prejudice detection. Frontiers in Organizational Psychology, 4, 1629459. Link ↗
- Brown, A. S., & Murphy, D. R. (1989). Cryptomnesia: delineating inadvertent plagiarism. Journal of Experimental Psychology: Learning, Memory, and Cognition, 15(3), 432–442. Link ↗
- Heilman, M. E., & Haynes, M. C. (2005). No credit where credit is due: attributional rationalization of women’s success in male–female teams. Journal of Applied Psychology, 90(5), 905–916. Link ↗
- Okonofua, J. A., & Eberhardt, J. L. (2015). Two strikes: race and the disciplining of young students. Psychological Science, 26(5), 617–624. Link ↗
- Uhlmann, E. L., & Cohen, G. L. (2007). “I think it, therefore it’s true”: effects of self-perceived objectivity on hiring discrimination. Organizational Behavior and Human Decision Processes, 104(2), 207–223. Link ↗
- Sackett, P. R., Zhang, C., Berry, C. M., & Lievens, F. (2022). Revisiting meta-analytic estimates of validity in personnel selection. Journal of Applied Psychology, 107(11), 2040–2068. Link ↗
- Arslan, C., Chang, E. H., Chilazi, S., Bohnet, I., & Hauser, O. P. (2025). Behaviorally designed training leads to more diverse hiring. Science, 387(6732), 364–366. Link ↗
- Bohnet, I., van Geen, A., & Bazerman, M. (2016). When performance trumps gender bias: joint versus separate evaluation. Management Science, 62(5), 1225–1234. Link ↗
- Dobbin, F., & Kalev, A. (2016). Why diversity programs fail. Harvard Business Review, July–August 2016. Link ↗
- Behavioural Economics Team of the Australian Government (2017). Going blind to see more clearly: unconscious bias in Australian Public Service shortlisting decisions. Link ↗
- Behaghel, L., Crépon, B., & Le Barbanchon, T. (2015). Unintended effects of anonymous résumés. American Economic Journal: Applied Economics, 7(3), 1–27. Link ↗
- McCarthy, J. M., Van Iddekinge, C. H., & Campion, M. A. (2010). Are highly structured job interviews resistant to demographic similarity effects? Personnel Psychology, 63(2), 325–359. Link ↗